EverMark Q4 2026 Market Outlook: Higher Rates, Record Highs, Elections, and AI
October 9, 2026
Matt Sweeney, CFP®
Founder, Investment Manager
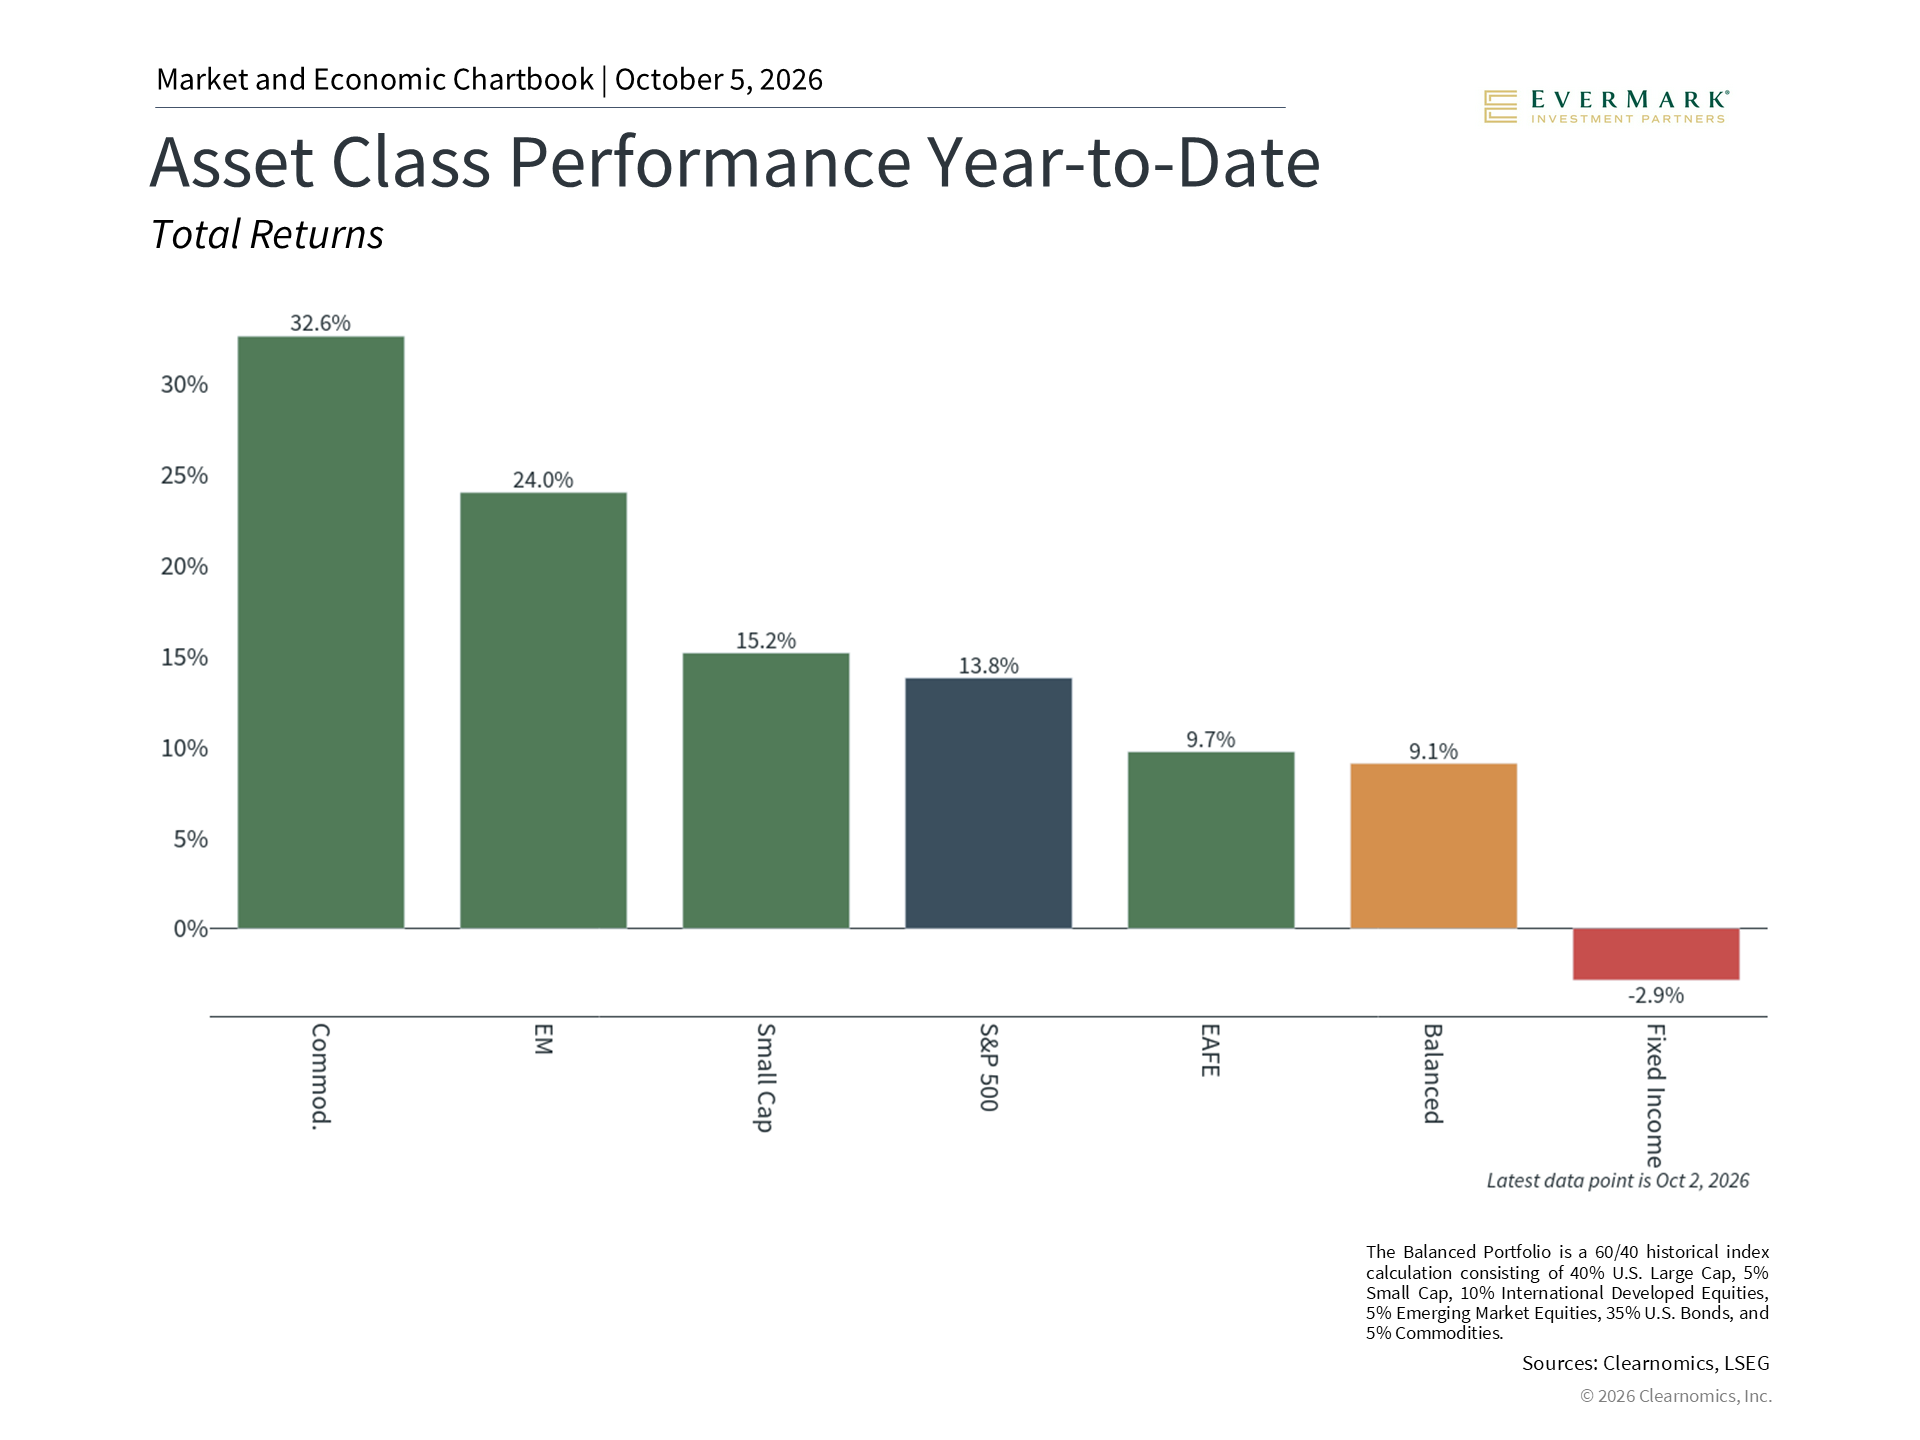
The third quarter of 2026 brought two major forces that shaped investor portfolios. Interest rates climbed to their highest levels in 20 years, while strong corporate earnings continued to lift stocks. Oil prices rose back above $100 per barrel, the Federal Reserve (the central bank of the United States) raised interest rates for the first time in three years, and questions around artificial intelligence (AI) grew as the November midterm elections drew closer. Despite all of this, major U.S. stock indexes ended the quarter near record levels, with gains spread across energy stocks, international stocks, and commodities. Bonds faced pressure as rates rose, but now offer some of the most attractive income levels seen in years. These trends are a reminder that keeping a balanced portfolio is key, especially as new opportunities for long-term investing continue to emerge heading into the fourth quarter. Investors are navigating a new era of higher interest rates
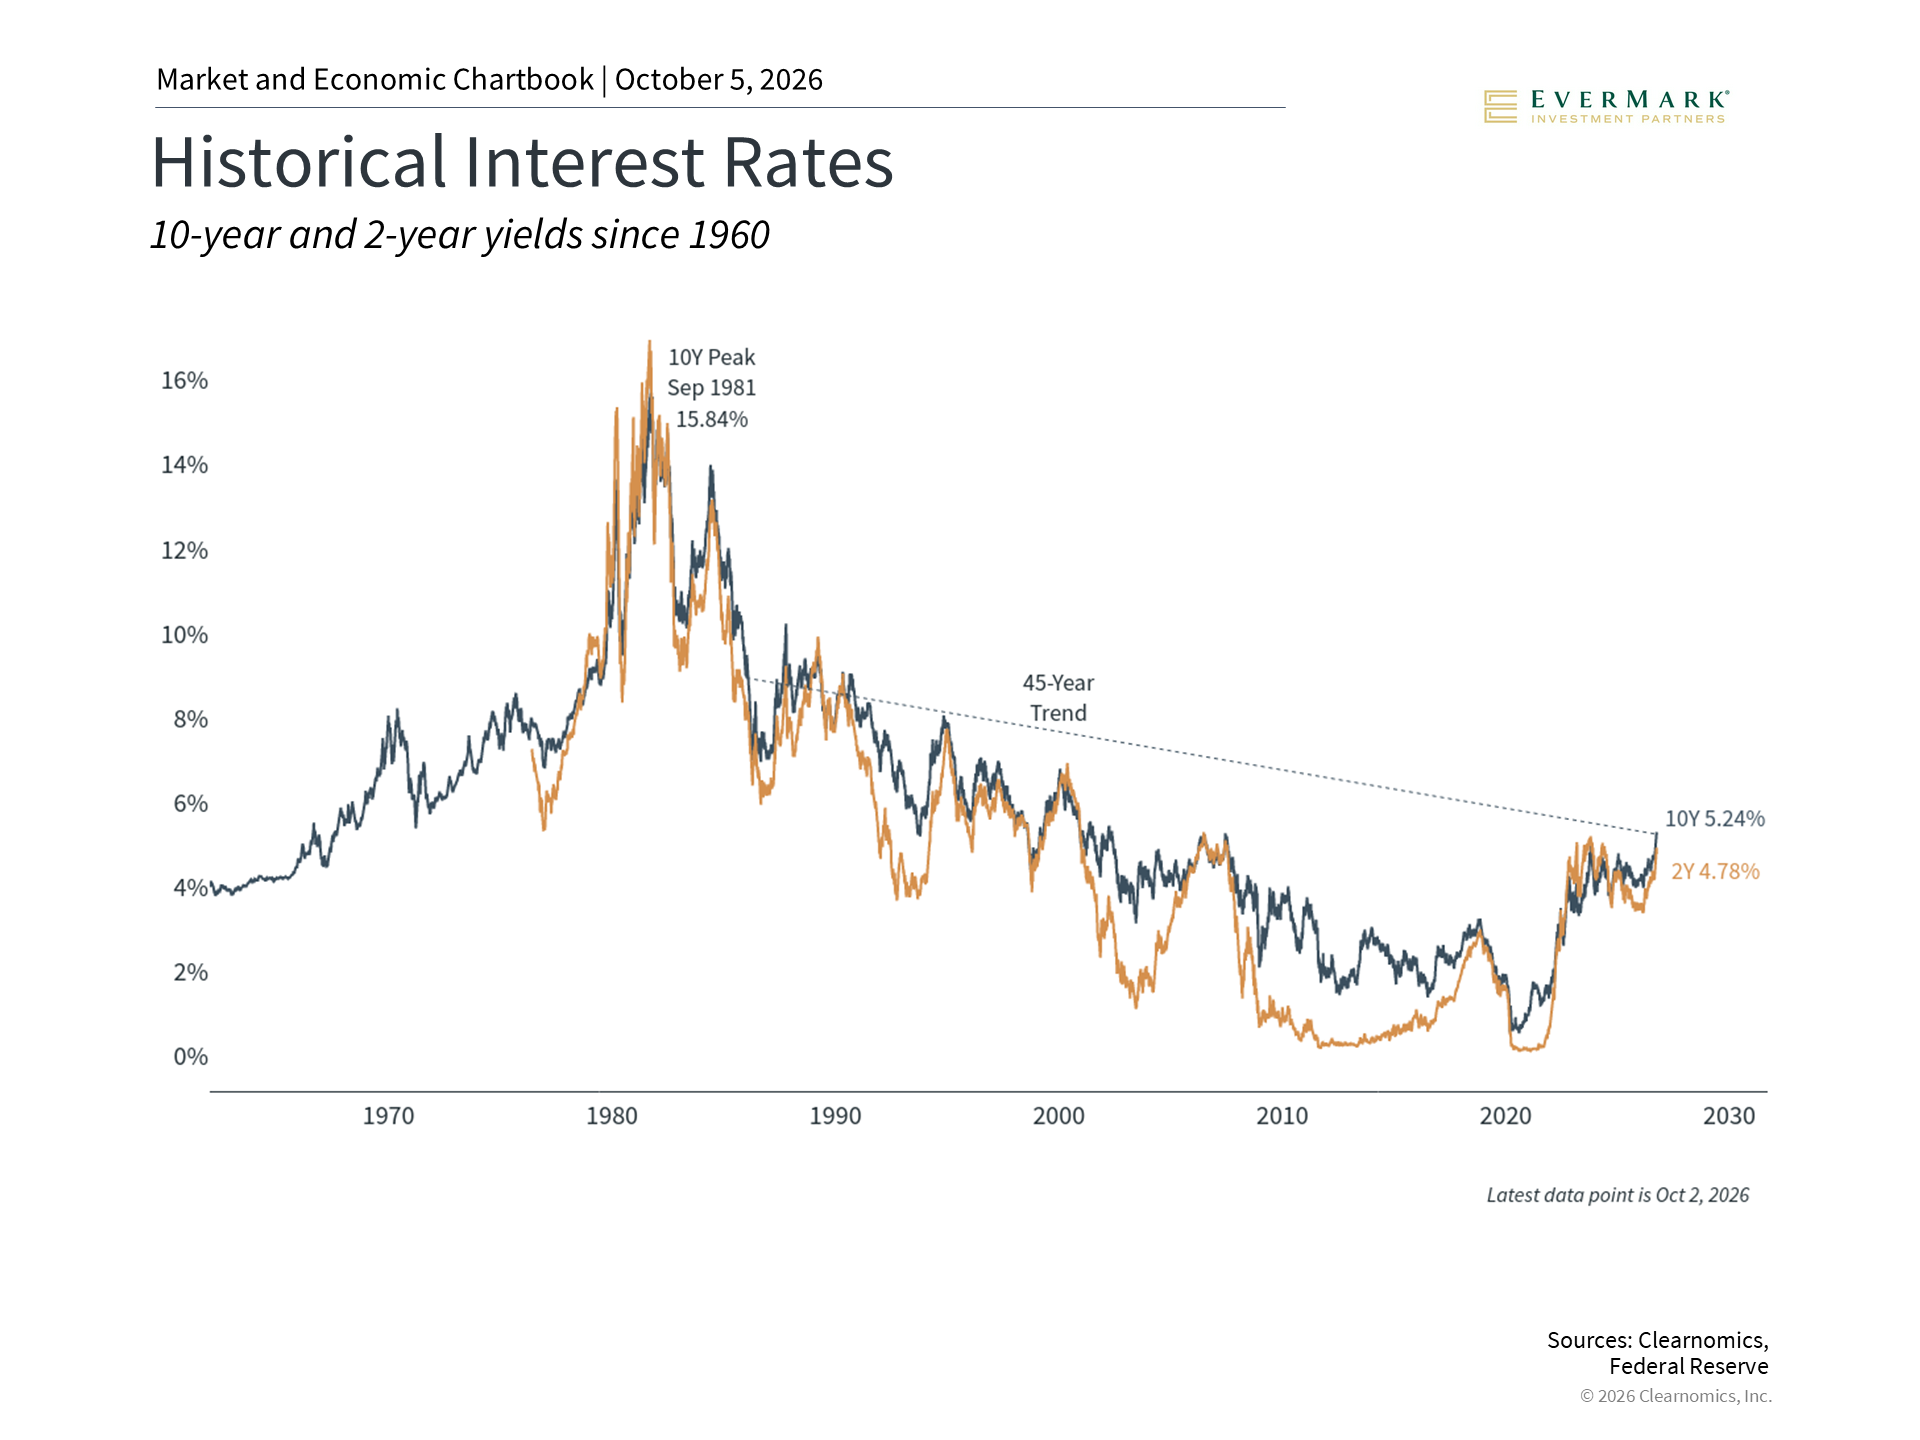
The standout theme of Q3 2026 was rising interest rates, which reached levels not seen since the early 2000s. For everyday investors, this matters because bonds can now generate more income than they have in many years, making them a more meaningful part of a balanced portfolio. From the early 1980s to 2020, interest rates gradually fell over decades, a trend sometimes called a 40-year bond bull market. That era of very low rates is now behind us, and higher rates are reshaping many areas of the economy, including housing. According to Freddie Mac, the average 30-year fixed-rate mortgage climbed back above 7% after falling toward 6% at the start of the year.3 This has reduced the incentive for homeowners locked into low rates to sell, slowing housing activity. Strong earnings and AI investment are lifting markets broadly
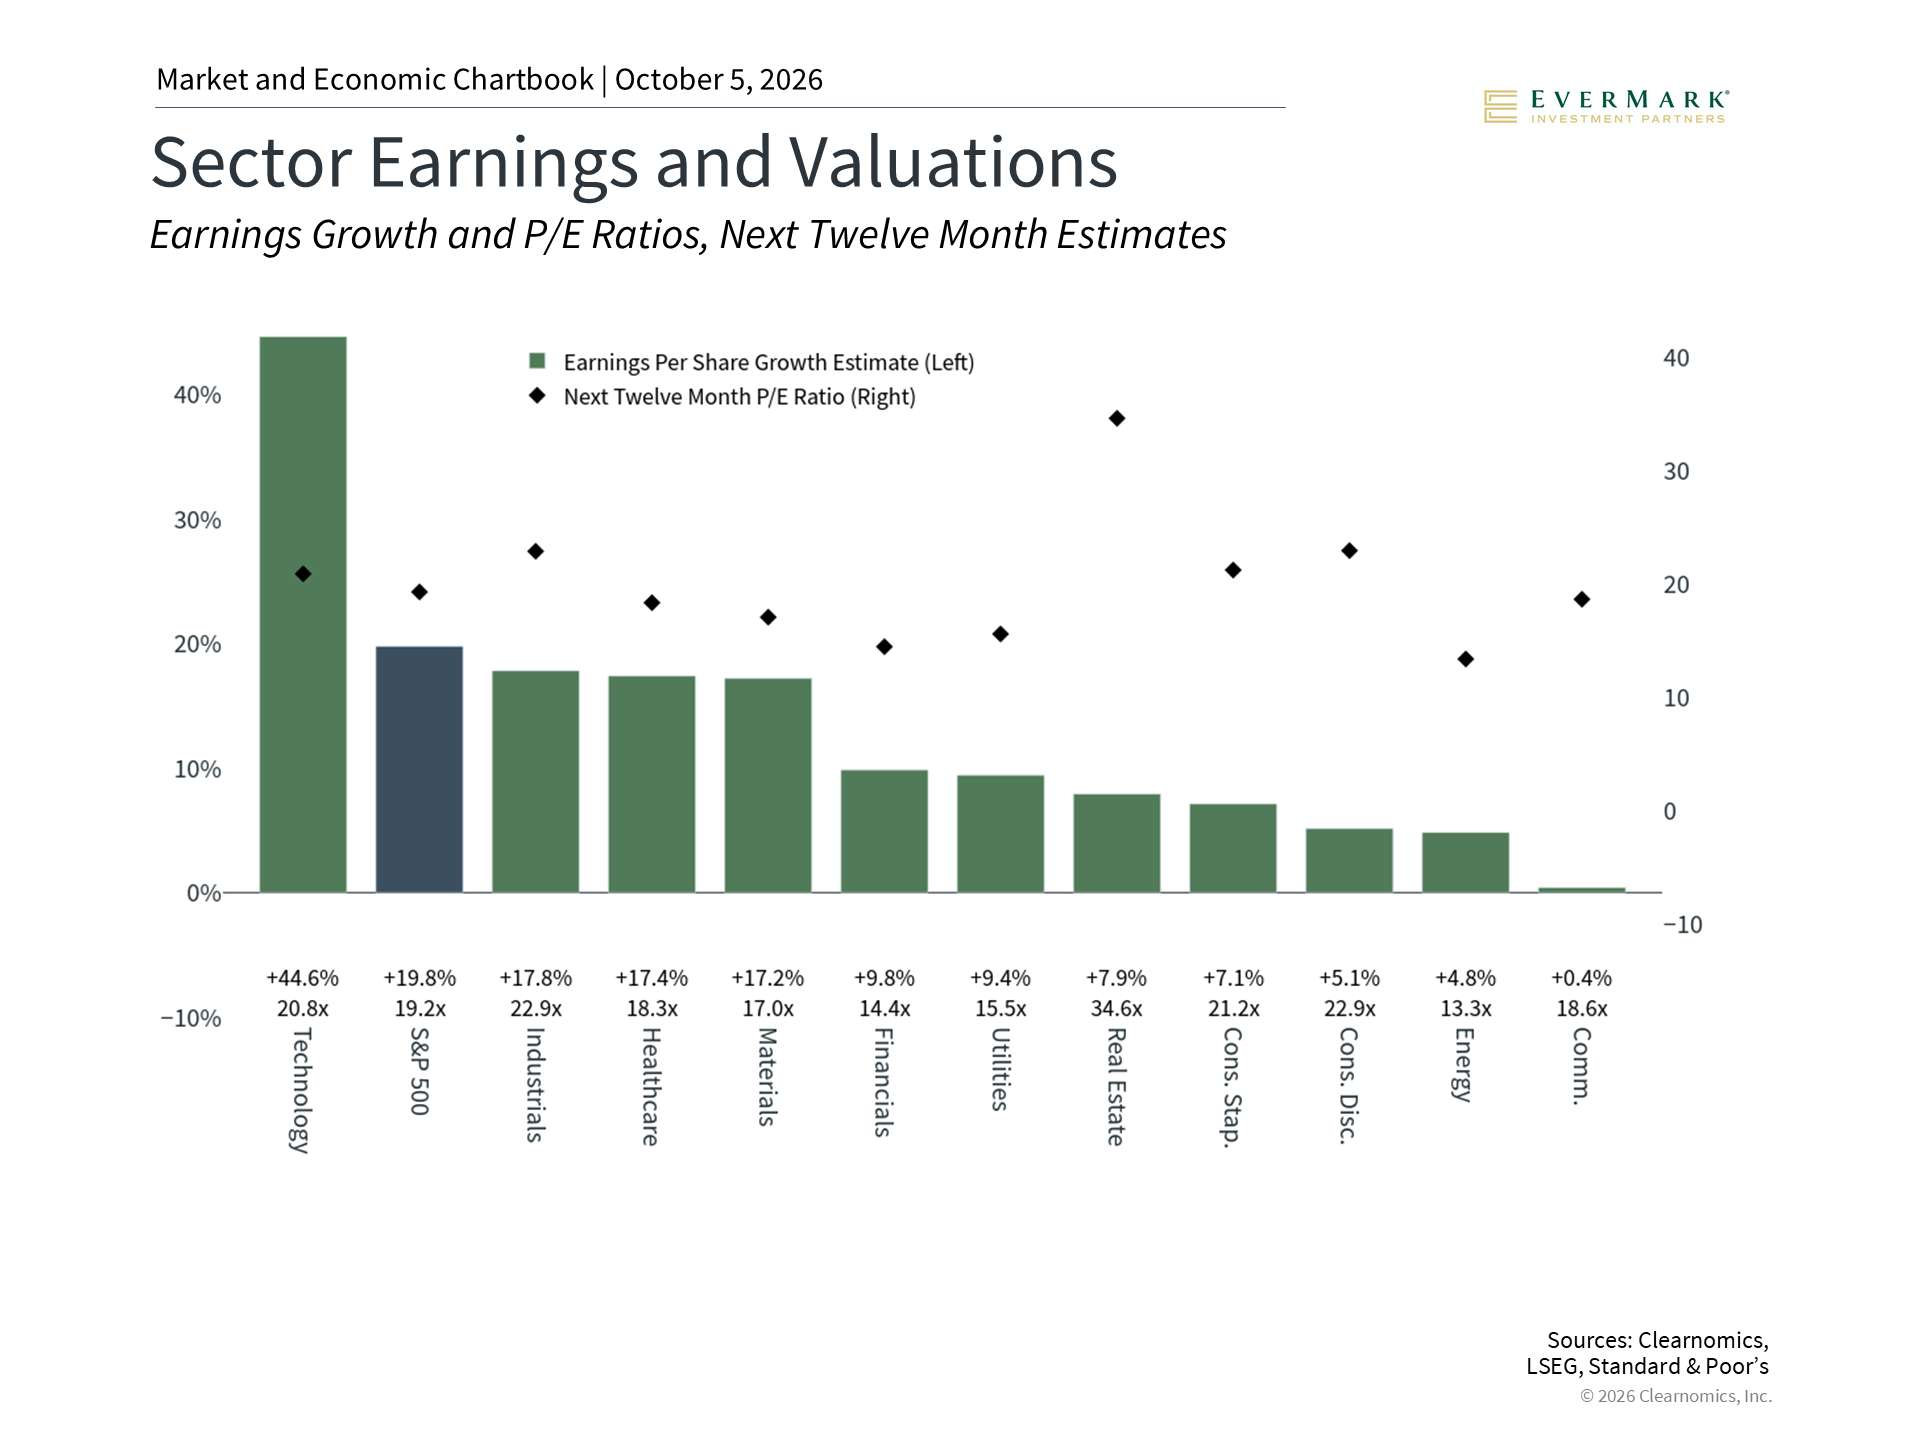
Despite periods of short-term uncertainty, the S&P 500, Nasdaq, and Dow Jones Industrial Average all reached new all-time highs during the third quarter. A strong economy and growing investment in AI infrastructure have supported corporate profits. Current estimates suggest S&P 500 earnings could grow more than 30% over the next twelve months.4 Gains were not limited to U.S. large company stocks. Smaller companies and international markets, especially semiconductor firms in Asia tied to AI, also contributed.5 Commodities rose as well, with oil climbing from around $70 per barrel in early July to over $100 in September due to Middle East tensions, and copper reaching a new record high driven by AI infrastructure demand. This broad participation across asset classes highlights the value of a well-diversified portfolio. Midterm elections and policy uncertainty ahead
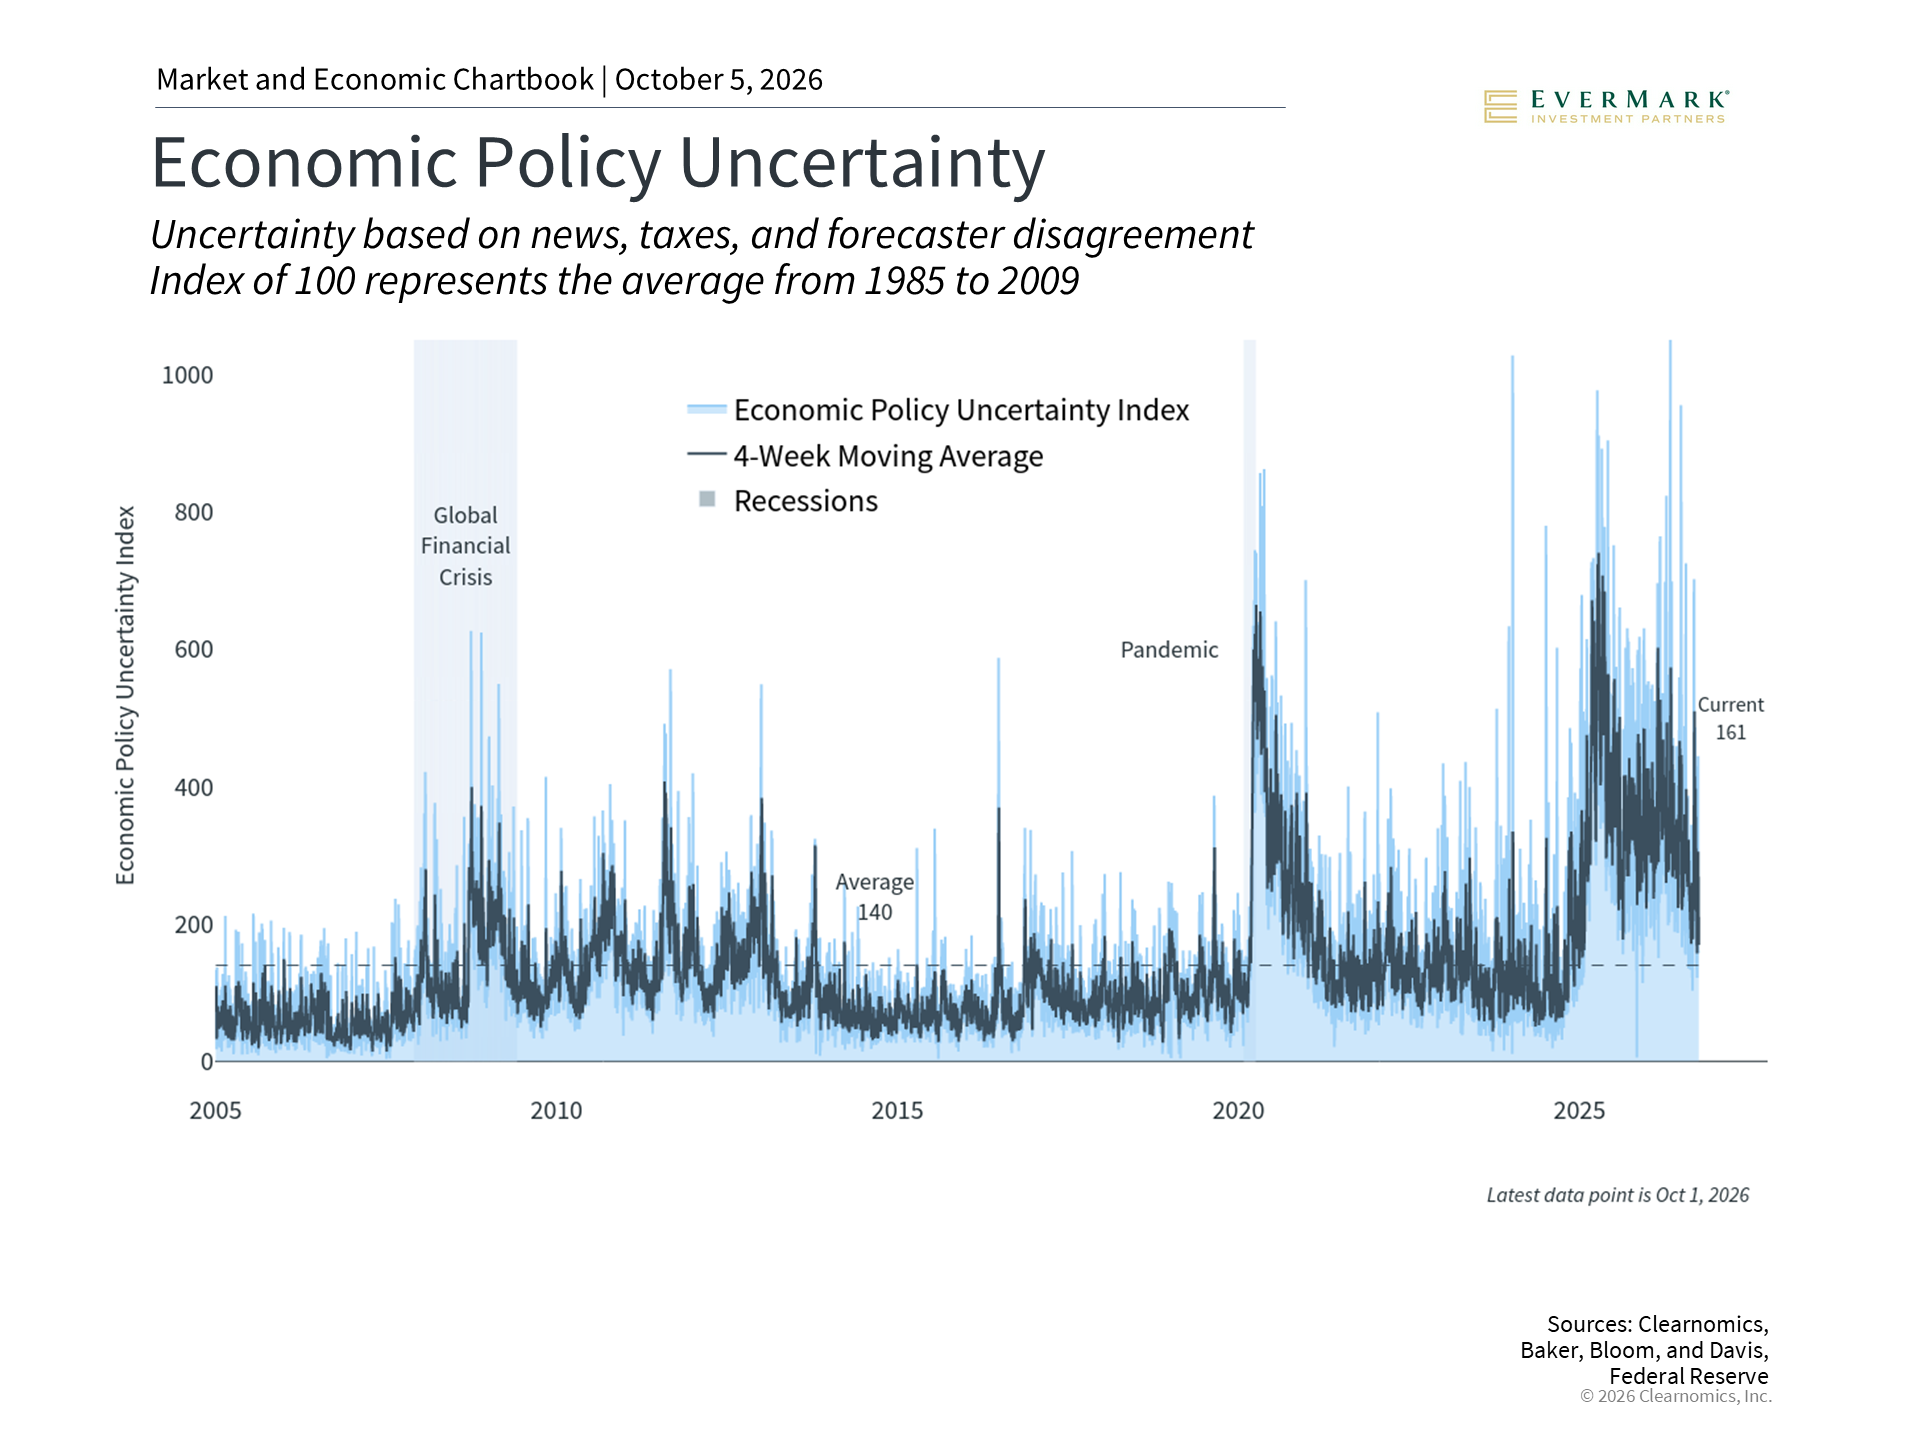
Elections shape important policy decisions, but when it comes to investing, it is important not to let political views drive portfolio decisions. History shows that the S&P 500 has averaged annual total returns of 8.6% across midterm election years since 1933.7 Markets have also performed well on average across different political configurations in Washington.8 It’s not unusual for a sitting president’s party to lose its majority in Congress during a midterm election, and this is exactly what occurred under Biden, Trump’s first term, Obama, and Clinton, just to name a few recent examples.8 Another area of concern for investors is the national debt, which recently exceeded $40 trillion for the first time, or roughly $120,000 per American.9 The annual budget deficit is projected to exceed $2 trillion for the government’s 2026 fiscal year.10 Over time, this could raise government borrowing costs. Still, focusing on a portfolio built to perform across a range of economic and political environments is more productive than trying to predict election outcomes. AI and productivity growth are reshaping stock market sectors
AI and technology trends have been major drivers of market performance in recent years. The chart above shows the difference in earnings growth between the Information Technology sector and the other ten S&P 500 sectors.11 Groups such as the Magnificent 7 have been at the center of this trend. Some investors worry about “concentration risk,” meaning the market being driven by only a handful of stocks, but other sectors have also delivered strong returns. The bigger question is whether AI will deliver lasting productivity gains across the broader economy. So far, the 2020s have seen average productivity growth of 2.1% per year, compared to just 1.2% in the 2010s. Whether this trend continues will likely influence markets for years to come. Keeping a longer-term perspective, understanding how technology trends interact with higher rates, and staying focused on financial goals remain the most important priorities heading into Q4 2026. The bottom line? Stocks reached new highs in the third quarter, with many asset classes contributing to portfolios, despite bonds struggling as interest rates rise. As new developments unfold and the midterm election approaches, investors should continue to stay balanced and focus on financial goals. References 1. Return figures represent total returns with reinvested dividends. All figures as of September 30, 2026 2. Clearnomics research using Federal Reserve data, as of September 30, 2026 3. https://www.freddiemac.com/pmms 4. Clearnomics research using LSEG data, as of September 30, 2026 5. Clearnomics research using FTSE Russell and MSCI data, as of September 30, 2026 6. https://www.cmegroup.com/markets/interest-rates/cme-fedwatch-tool.html 7. Clearnomics research using Standard & Poor’s data, as of September 30, 2026 8. Clearnomics research using Standard & Poor’s data, as of September 30, 2026 9. https://fiscaldata.treasury.gov/americas-finance-guide/national-debt/ 10. Clearnomics research using LSEG and Standard & Poor’s data, as of September 30, 2026 11. https://fiscaldata.treasury.gov/americas-finance-guide/national-deficit/https://fiscaldata.treasury.gov/americas-finance-guide/national-debt/ Index Descriptions S&P 500 The Standard & Poor’s 500 Index is a capitalization-weighted index of 500 stocks designed to measure performance of the broad domestic economy through changes in the aggregate market value of 500 stocks representing all major industries. The modern design of the S&P 500 stock index was first launched in 1957. Performance prior to 1957 incorporates the performance of the predecessor index, the S&P 90. Dow Jones The Dow Jones Industrial Average consists of 30 stocks that are major factors in their industries and widely held by individuals and institutional investors. NASDAQ The NASDAQ Composite Index measures all NASDAQ domestic and non-U.S. based common stocks listed on The NASDAQ Stock Market. The market value, the last sale price multiplied by total shares outstanding, is calculated throughout the trading day, and is related to the total value of the Index. MSCI Emerging Markets Index The MSCI EM (Emerging Markets) Index is a free float-adjusted market capitalization weighted index that is designed to measure the equity market performance of the emerging market countries of the Americas, Europe, the Middle East, Africa and Asia. The MSCI EM Index consists of the following emerging market country indices: Brazil, Chile, Colombia, Mexico, Peru, Czech Republic, Egypt, Greece, Hungary, Poland, Qatar, Russia, South Africa, Turkey, United Arab Emirates, China, India, Indonesia, Korea, Malaysia, Philippines, Taiwan, and Thailand. MSCI EAFE Index The MSCI EAFE Index is a free float-adjusted market capitalization index that is designed to measure the equity market performance of developed markets, excluding the US & Canada. The MSCI EAFE Index consists of the following developed country indices: Australia, Austria, Belgium, Denmark, Finland, France, Germany, Hong Kong, Ireland, Israel, Italy, Japan, the Netherlands, New Zealand, Norway, Portugal, Singapore, Spain, Sweden, Switzerland and the UK. Bloomberg US Aggregate Bond Index The Bloomberg U.S. Aggregate Bond Index is an index of the U.S. investment-grade fixed-rate bond market, including both government and corporate bonds. DXY The DXY is a U.S. dollar index based on a basket of currencies, including the Euro, Yen, Pound, Canadian Dollar, Swedish Krona and Swiss Franc. |
Securities and Advisory Services offered through LPL Financial, a Registered Investment Advisor. Member FINRA & SIPC. Copyright (c) 2026 Clearnomics, Inc. All rights reserved. The information contained herein has been obtained from sources believed to be reliable, but is not necessarily complete and its accuracy cannot be guaranteed. No representation or warranty, express or implied, is made as to the fairness, accuracy, completeness, or correctness of the information and opinions contained herein. The views and the other information provided are subject to change without notice. All reports posted on or via www.clearnomics.com or any affiliated websites, applications, or services are issued without regard to the specific investment objectives, financial situation, or particular needs of any specific recipient and are not to be construed as a solicitation or an offer to buy or sell any securities or related financial instruments. Past performance is not necessarily a guide to future results. Company fundamentals and earnings may be mentioned occasionally, but should not be construed as a recommendation to buy, sell, or hold the company's stock. Predictions, forecasts, and estimates for any and all markets should not be construed as recommendations to buy, sell, or hold any security--including mutual funds, futures contracts, and exchange traded funds, or any similar instruments. The text, images, and other materials contained or displayed in this report are proprietary to Clearnomics, Inc. and constitute valuable intellectual property. All unauthorized reproduction or other use of material from Clearnomics, Inc. shall be deemed willful infringement(s) of this copyright and other proprietary and intellectual property rights, including but not limited to, rights of privacy. Clearnomics, Inc. expressly reserves all rights in connection with its intellectual property, including without limitation the right to block the transfer of its products and services and/or to track usage thereof, through electronic tracking technology, and all other lawful means, now known or hereafter devised. Clearnomics, Inc. reserves the right, without further notice, to pursue to the fullest extent allowed by the law any and all criminal and civil remedies for the violation of its rights. |