How 7% Mortgage Rates Are Shaping the Housing Market and Economy
October 9, 2026

Matt Sweeney, CFP®
Founder, Investment Manager
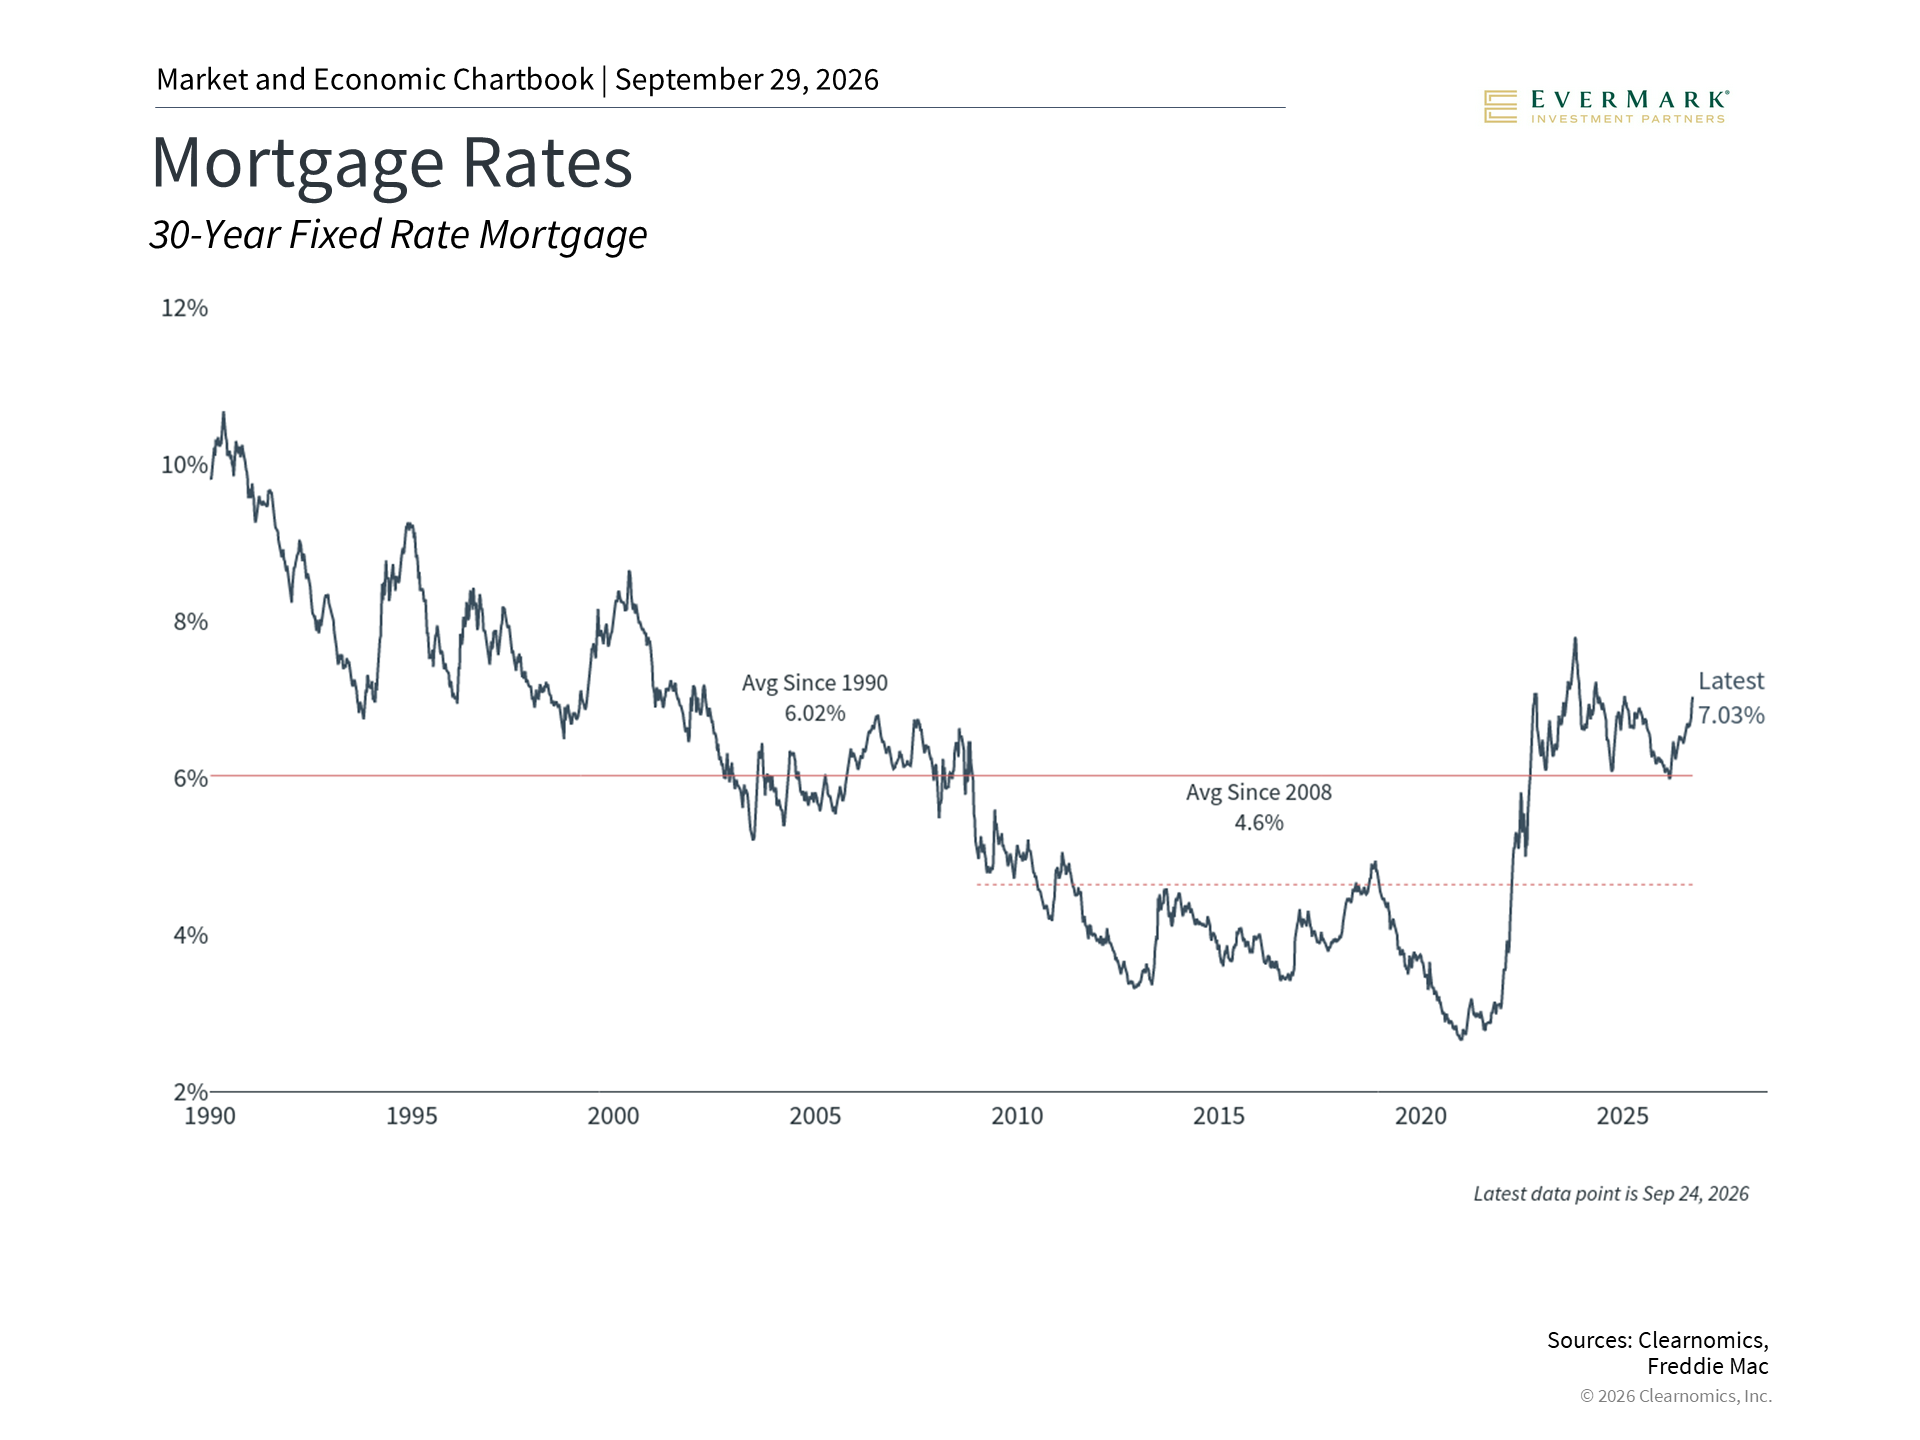
The housing market matters to everyday households and the broader economy alike. For most families, buying a home is a major life goal that takes years of preparation. A home is often a household’s biggest asset and largest monthly expense. On a national scale, housing makes up between 15% and 18% of total economic activity.1 Because of this, changes in the housing market can affect how confident consumers feel, the health of household finances, and overall economic growth. One of the biggest drivers of housing activity is interest rates. When interest rates rise, it costs more to borrow money for a home, which affects how many people can qualify for a mortgage and how many homes are bought and sold. The average 30-year fixed mortgage rate has climbed back above 7%, a level not seen consistently in nearly 25 years. What does this mean for homeowners, buyers, and the wider economy? Mortgage rates have climbed back above 7%
Mortgage rates fell steadily from the early 1980s through 2020, hitting their lowest point during the pandemic. From 1990 to the 2008 financial crisis, the average 30-year fixed rate was around 6%. After that, the average dropped to just 4.6%. Many buyers and homeowners grew used to rates of 3% or lower during the pandemic years, which were well below historical norms. The return to 7% creates what economists call the “lock-in” effect. Homeowners who locked in low rates years ago are reluctant to sell, because selling would mean taking on a new mortgage at today’s much higher rate. This reduces the number of homes available for sale. Policymakers are even exploring ideas like “portable mortgages,” which would let homeowners carry their lower rate with them when they move. Existing home sales fell 2.0% from the prior month and 1.2% from a year earlier in August, according to the National Association of Realtors.2 The supply of existing homes on the market is now at 4.9 months, while new homes sit at 8.5 months of supply, the highest levels in over a decade.3 For buyers who do enter the market, higher rates mean a bigger portion of monthly income goes toward mortgage payments, making it harder to afford a home. Home prices remain near record highs despite fewer sales
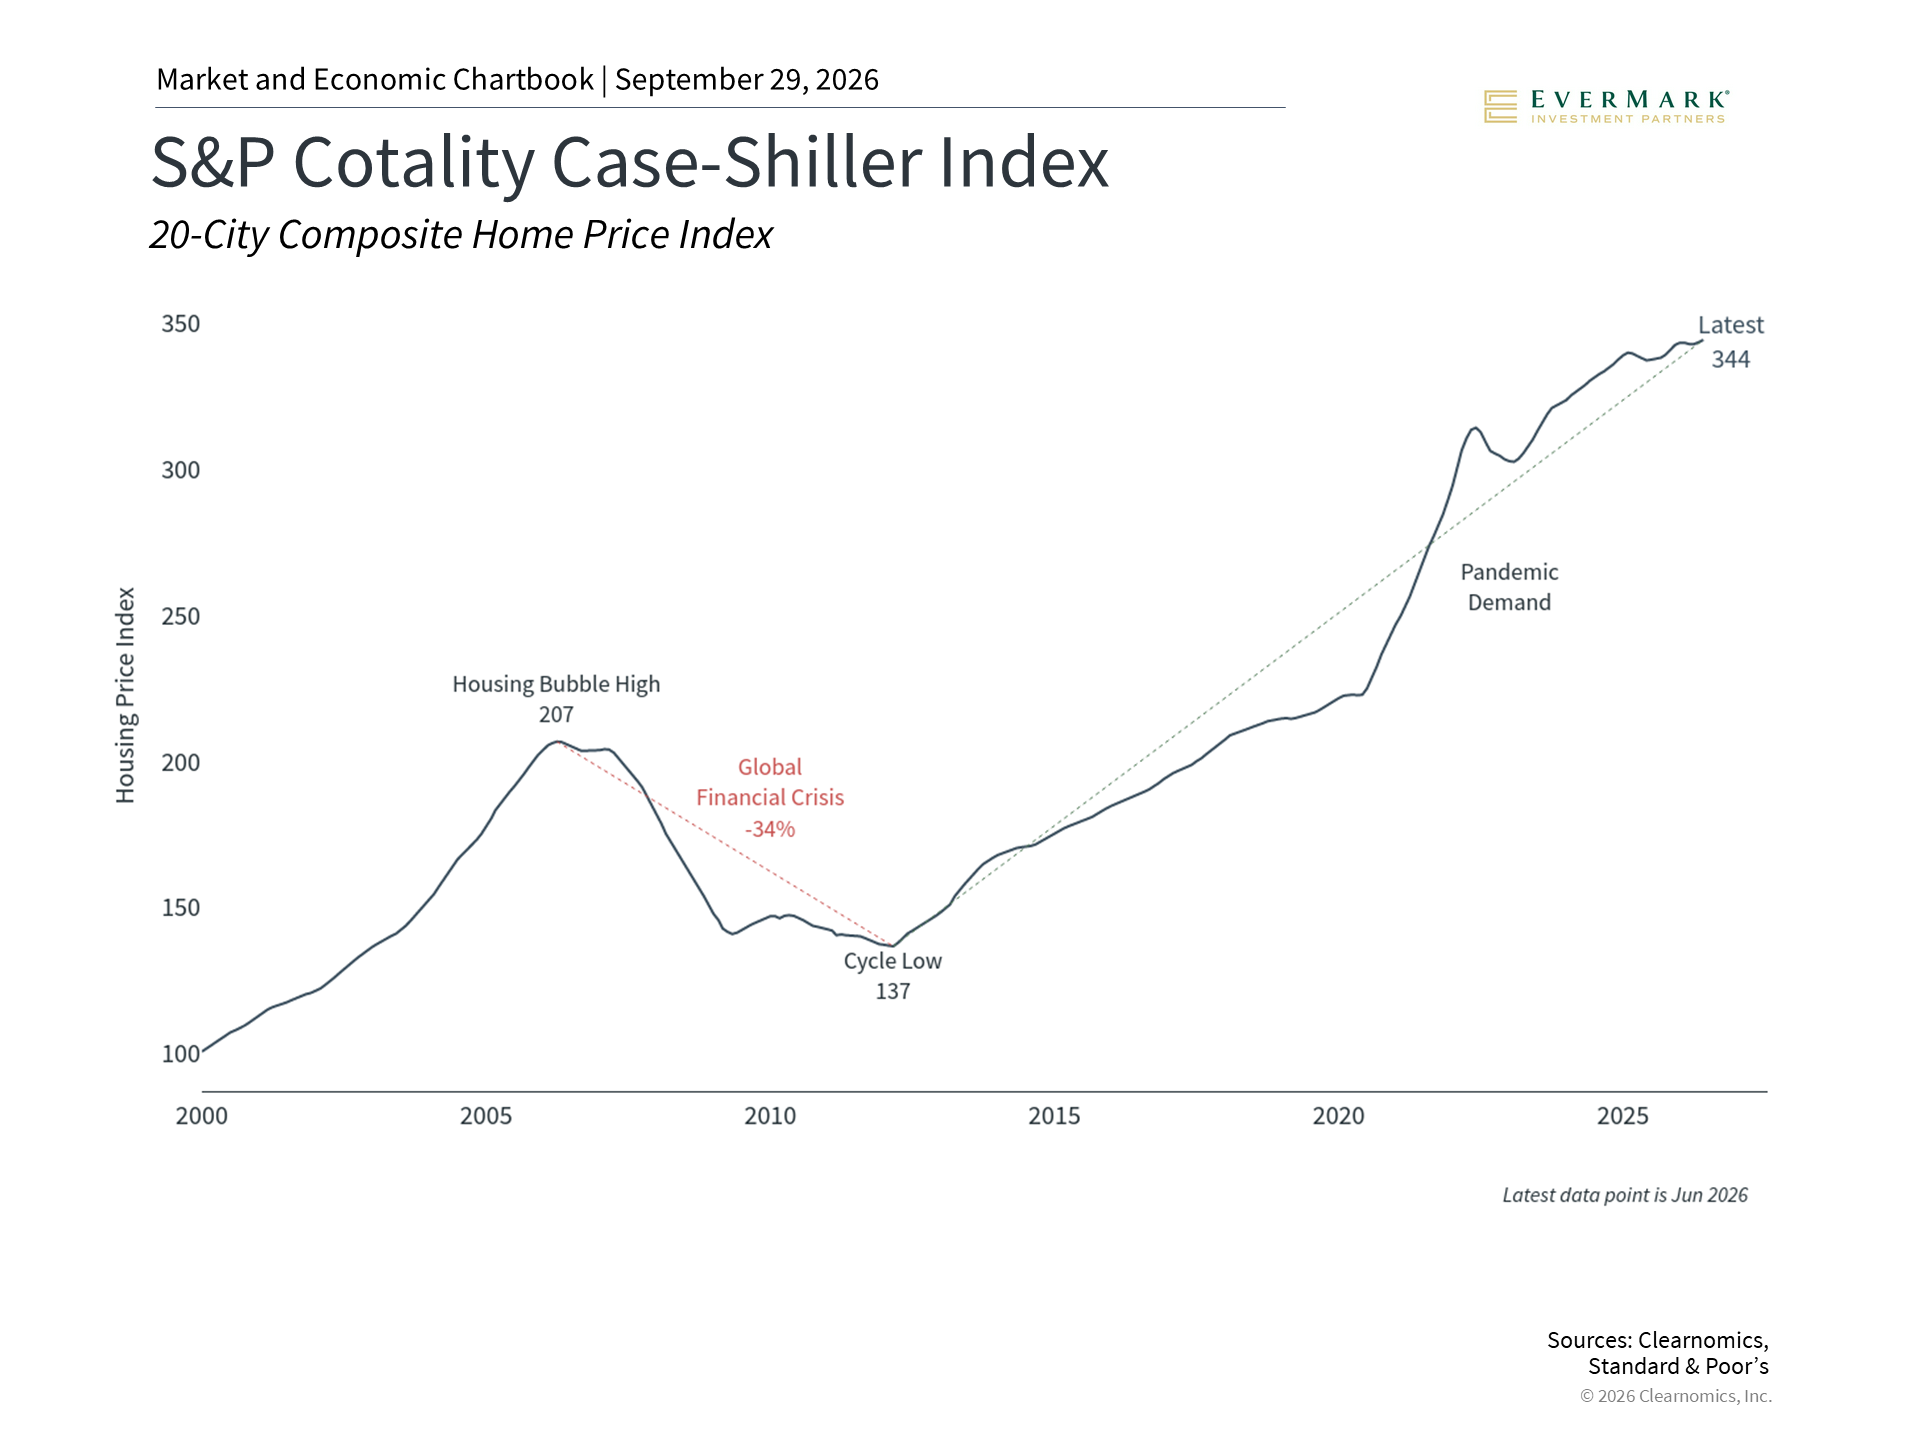
Even though fewer homes are being bought and sold, home prices across the country are still near record highs, according to the S&P Cotality Case-Shiller Index. This can happen when the economy is generally healthy and unemployment is low. Homeowners who can afford their payments have little reason to sell, which keeps prices supported. High home values contribute to what is often called the “wealth effect.” When people feel their homes are holding or gaining value, they tend to feel more financially secure and may spend more. Combined with a stock market near all-time highs, this helps explain why consumer spending has stayed relatively strong despite concerns like tariffs and higher energy costs. Refinancing activity has dropped sharply as rates rise
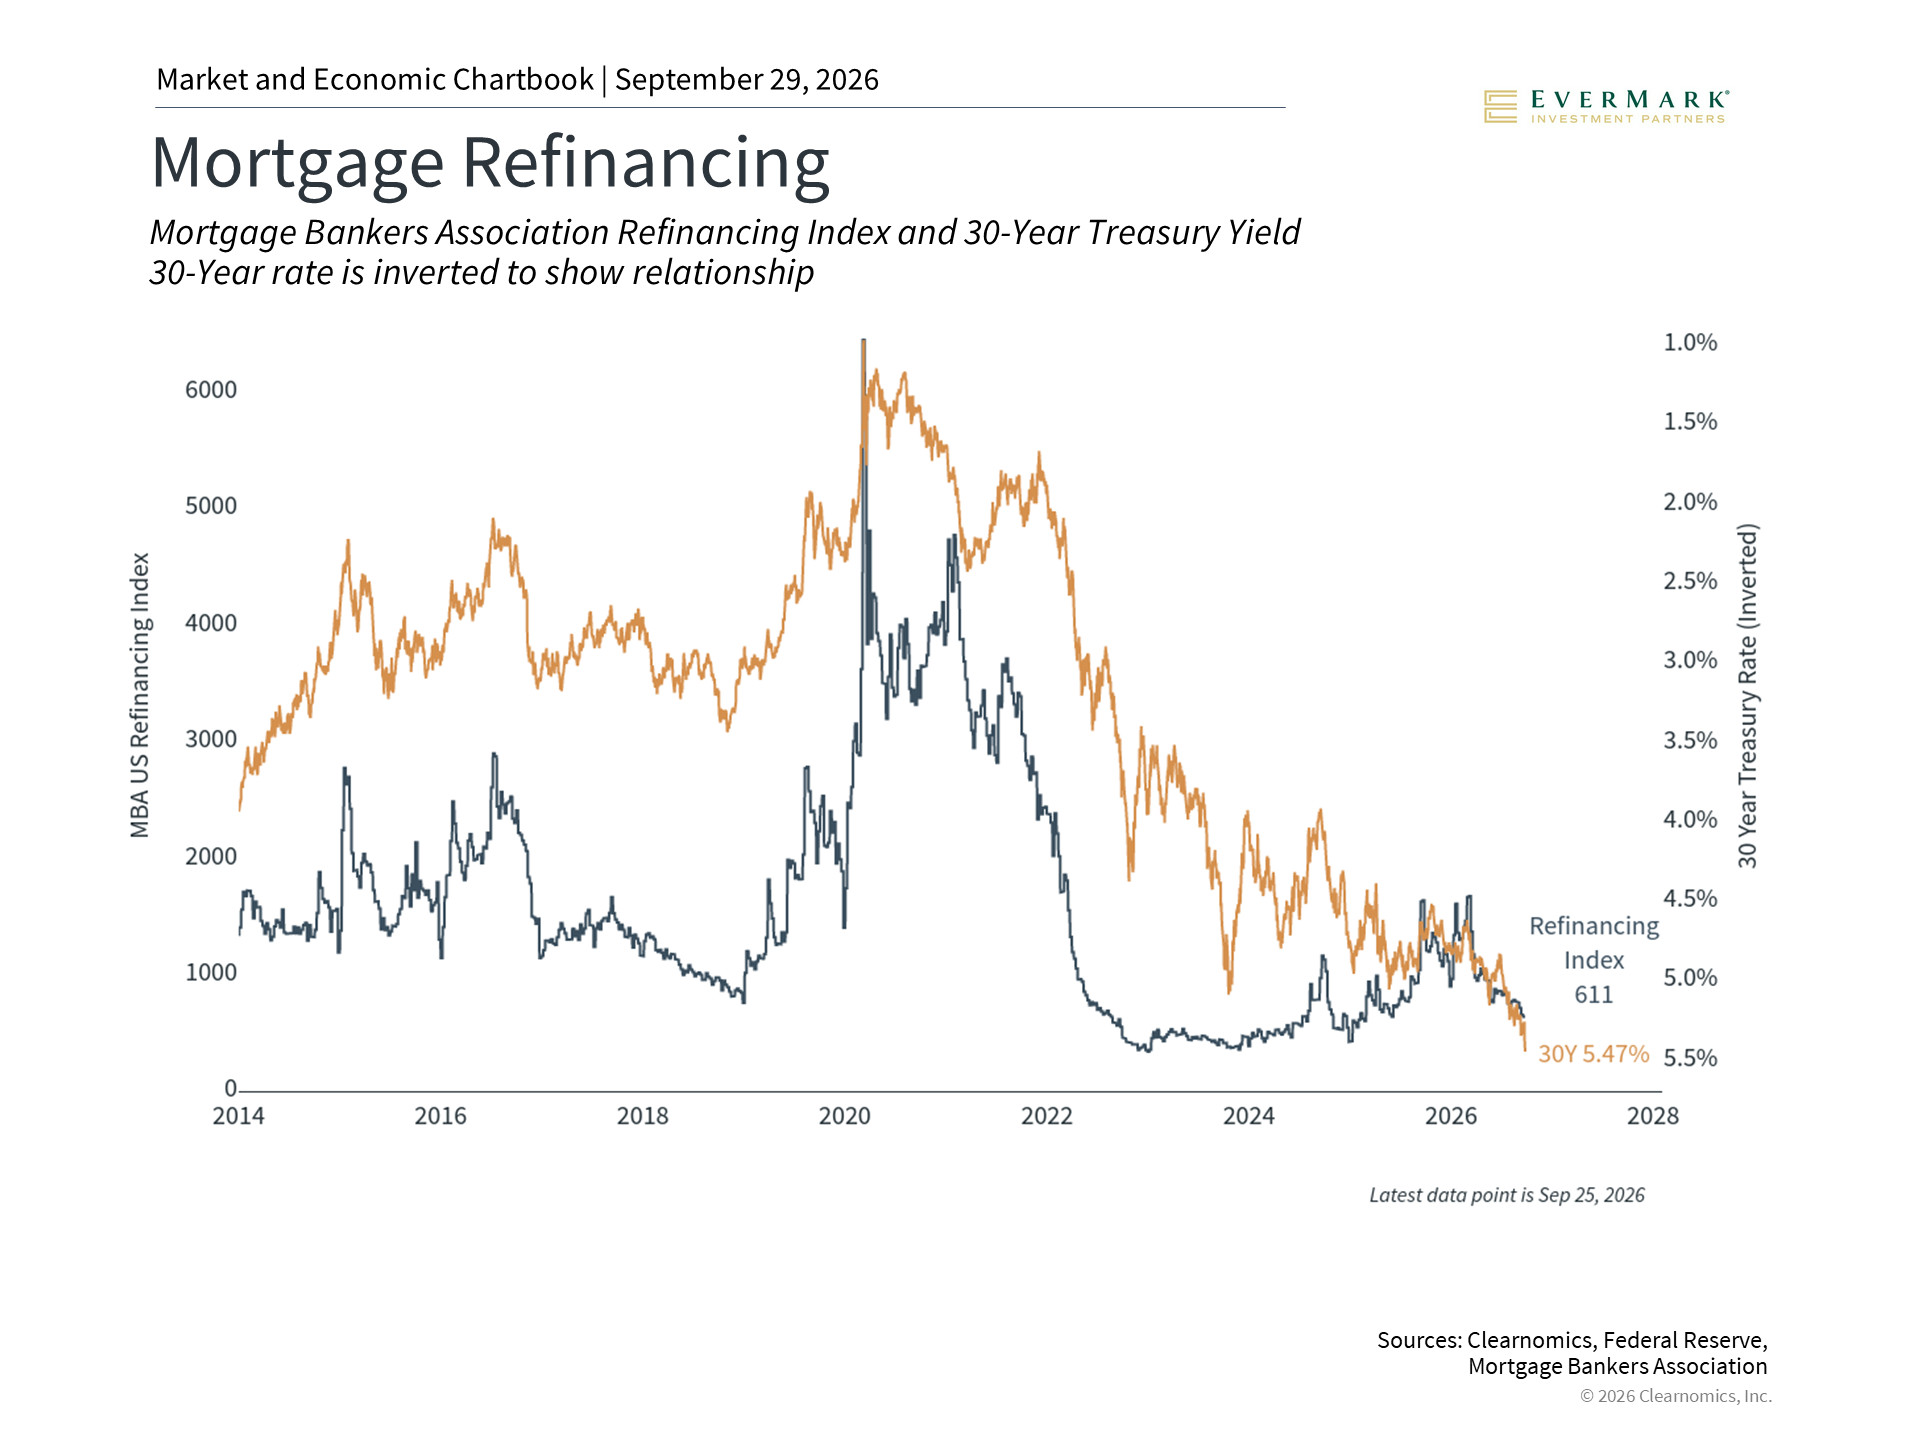
As mortgage rates have risen, far fewer homeowners are refinancing their loans. Refinancing means replacing an existing mortgage with a new one, often to get a lower payment or to access the equity (value) built up in the home. Data from the Mortgage Bankers Association shows that refinancing volumes have dropped to multi-year lows after peaking between 2020 and 2022.6 When homeowners cannot refinance at attractive rates, one way they might otherwise boost their spending is no longer available to them. Despite this, household debt levels remain manageable overall. Debt payments as a share of disposable income stood at around 11% in the second quarter of this year, well below the nearly 16% peak seen before the 2008 financial crisis.7 How long this situation lasts will depend on how long interest rates stay elevated. With inflation still above the Federal Reserve’s target, rates could remain high through at least 2027, according to the Fed’s own projections.9 Staying disciplined and focused on a long-term financial plan remains important for both investors and households. The bottom line? The housing market may continue to be affected by rising interest rates as mortgage rates jump past 7%. For investors, this period of higher rates requires staying vigilant and focusing on long-term planning. References 1. https://www.nahb.org/news-and-economics/housing-economics/housings-economic-impact/housings-contribution-to-gross-domestic-product 2. https://www.nar.realtor/newsroom/nar-existing-home-sales-report-shows-2-0-decrease-in-august 3. https://www.nar.realtor/research-and-statistics/housing-statistics/existing-home-sales 4. https://www.sca.isr.umich.edu/ 5. https://www.bls.gov/news.release/cpi.nr0.htm 6. Clearnomics research and the Mortgage Bankers Association, as of September 28, 2026 7. Clearnomics research and the Federal Reserve Economic Data, as of September 28, 2026 8. https://home.treasury.gov/policy-issues/financing-the-government/interest-rate-statistics 9. https://www.federalreserve.gov/monetarypolicy/fomcprojtabl20260916.htm Securities and Advisory Services are offered through, LPL Financial, a registered investment advisor. Member FINRA & SIPC. Index Descriptions S&P Cotality Case-Shiller Home Price Indices The S&P Cotality Case-Shiller 20-City Index measures the value of residential real estate and tracks changes in the selling prices of single-family homes across 20 major U.S. metropolitan areas. |
Copyright (c) 2026 Clearnomics, Inc. All rights reserved. The information contained herein has been obtained from sources believed to be reliable, but is not necessarily complete and its accuracy cannot be guaranteed. No representation or warranty, express or implied, is made as to the fairness, accuracy, completeness, or correctness of the information and opinions contained herein. The views and the other information provided are subject to change without notice. All reports posted on or via www.clearnomics.com or any affiliated websites, applications, or services are issued without regard to the specific investment objectives, financial situation, or particular needs of any specific recipient and are not to be construed as a solicitation or an offer to buy or sell any securities or related financial instruments. Past performance is not necessarily a guide to future results. Company fundamentals and earnings may be mentioned occasionally, but should not be construed as a recommendation to buy, sell, or hold the company's stock. Predictions, forecasts, and estimates for any and all markets should not be construed as recommendations to buy, sell, or hold any security--including mutual funds, futures contracts, and exchange traded funds, or any similar instruments. The text, images, and other materials contained or displayed in this report are proprietary to Clearnomics, Inc. and constitute valuable intellectual property. All unauthorized reproduction or other use of material from Clearnomics, Inc. shall be deemed willful infringement(s) of this copyright and other proprietary and intellectual property rights, including but not limited to, rights of privacy. Clearnomics, Inc. expressly reserves all rights in connection with its intellectual property, including without limitation the right to block the transfer of its products and services and/or to track usage thereof, through electronic tracking technology, and all other lawful means, now known or hereafter devised. Clearnomics, Inc. reserves the right, without further notice, to pursue to the fullest extent allowed by the law any and all criminal and civil remedies for the violation of its rights. |